September 2013

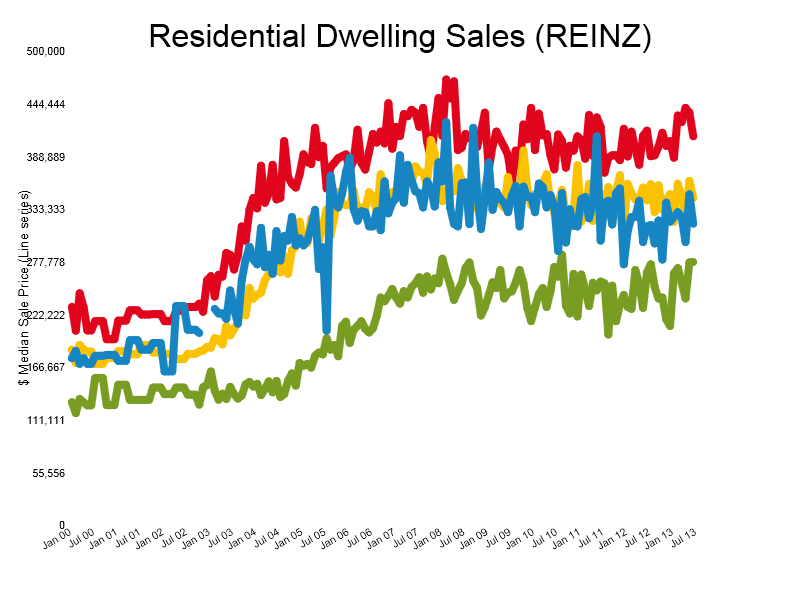
I would estimate that I have been investing for a full property cycle in the Bay of Plenty (12 years) Graph 1 .
Red Mount Maunganui
Yellow Tauranga
Blue Taupo
Green Rotorua
We all know what the capital growth in our properties have been but what about the growth in rental prices. I needed this information when preparing a cash flow budget for a rental property I was looking at buying last week. If you have an accurate picture of the past you should have a better idea of predicting the future.
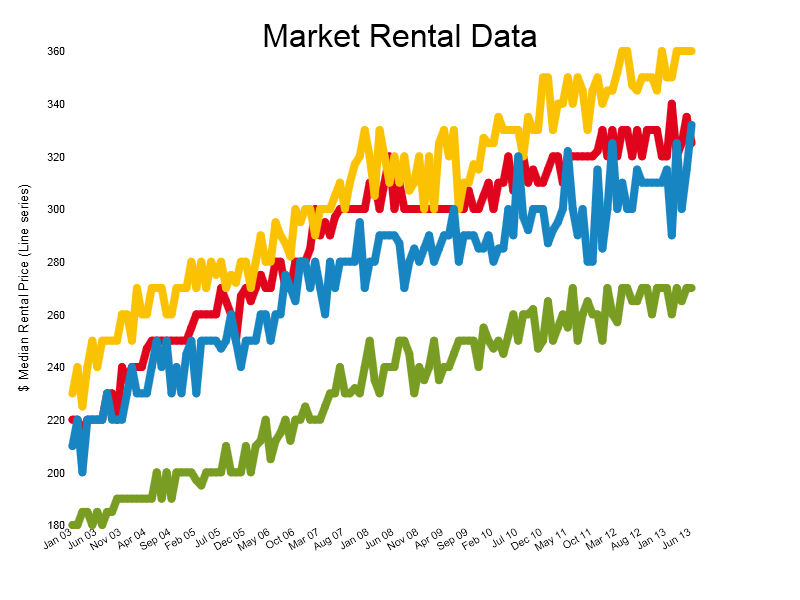
Graph 2 shows the rental data for the last 10 years in the areas I take an interest in

Yellow Mount Maunganui
Red Tauranga
Blue Taupo
Green Rotorua
I have owned 3 properties in Rotorua over this ten year period so can compare my examples with the Rotorua average on
3 BR properties $180 – $270 = 50%
2BR $165-$240 = 46%
1BR $110 – $158 = 44%
MY Properties below
3 BR town house in Westbrook $190- $280 = 47%
2 BR house in Hillcrest $140-$240 = 71%
1 BR Flat in Westbrook $110- $185 = 68%
This is an average of 6% rental growth per year.
To get ahead in property you need to be better than average as I have shown with my 1 & 2 BR properties. This has been achieved by careful selection of locations and higher quality but not cost renovations. I always get to choose from a good selection of tenants. The 3BR town house has the flat on the back of the section making Tenant interest a little tougher thus not the same price increases.
Need to know more about our Tauranga property management services?
Please call us on 027 454 3038
or email us at mike@focuspm.co.nz and we’ll get back to you within 24 hours
